Python の NumPy |セット 2 (上級)
Python の NumPy |セット 1 (導入) この記事では、NumPy で利用できる、さらに少し高度なメソッドについて説明します。
- 配列の順位決定要因トレースなど。
- 独自の値または行列
- 行列とベクトルの積 (ドットの内外積など) 行列のべき乗
- 線形方程式やテンソル方程式などを解きます。
- http://scipy.github.io/old-wiki/pages/EricsBroadcastingDoc
- https://numpy.org/doc/stable/reference/arrays.datetime.html#arrays-dtypes-dateunits
- https://numpy.org/doc/stable/reference/routines.linalg.html
- https://glowingpython.blogspot.com/2012/03/linear-regression-with-numpy.html
import numpy as np a = np . array ([[ 1 2 ] [ 3 4 ]]) b = np . array ([[ 5 6 ] [ 7 8 ]]) # vertical stacking print ( 'Vertical stacking: n ' np . vstack (( a b ))) # horizontal stacking print ( ' n Horizontal stacking: n ' np . hstack (( a b ))) c = [ 5 6 ] # stacking columns print ( ' n Column stacking: n ' np . column_stack (( a c ))) # concatenation method print ( ' n Concatenating to 2nd axis: n ' np . concatenate (( a b ) 1 ))
Output: Vertical stacking: [[1 2] [3 4] [5 6] [7 8]] Horizontal stacking: [[1 2 5 6] [3 4 7 8]] Column stacking: [[1 2 5] [3 4 6]] Concatenating to 2nd axis: [[1 2 5 6] [3 4 7 8]]
import numpy as np a = np . array ([[ 1 3 5 7 9 11 ] [ 2 4 6 8 10 12 ]]) # horizontal splitting print ( 'Splitting along horizontal axis into 2 parts: n ' np . hsplit ( a 2 )) # vertical splitting print ( ' n Splitting along vertical axis into 2 parts: n ' np . vsplit ( a 2 ))
Output: Splitting along horizontal axis into 2 parts: [array([[1 3 5] [2 4 6]]) array([[ 7 9 11] [ 8 10 12]])] Splitting along vertical axis into 2 parts: [array([[ 1 3 5 7 9 11]]) array([[ 2 4 6 8 10 12]])]
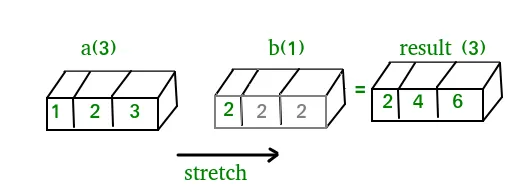
A(2-D array): 4 x 3 B(1-D array): 3 Result : 4 x 3A(4-D array): 7 x 1 x 6 x 1 B(3-D array): 3 x 1 x 5 Result : 7 x 3 x 6 x 5But this would be a mismatch:A: 4 x 3 B: 4The simplest broadcasting example occurs when an array and a scalar value are combined in an operation. Consider the example given below: PythonOutput:import numpy as np a = np . array ([ 1.0 2.0 3.0 ]) # Example 1 b = 2.0 print ( a * b ) # Example 2 c = [ 2.0 2.0 2.0 ] print ( a * c )[ 2. 4. 6.] [ 2. 4. 6.]We can think of the scalar b being stretched during the arithmetic operation into an array with the same shape as a. The new elements in b as shown in above figure are simply copies of the original scalar. Although the stretching analogy is only conceptual. Numpy is smart enough to use the original scalar value without actually making copies so that broadcasting operations are as memory and computationally efficient as possible. Because Example 1 moves less memory (b is a scalar not an array) around during the multiplication it is about 10% faster than Example 2 using the standard numpy on Windows 2000 with one million element arrays! The figure below makes the concept more clear:In above example the scalar b is stretched to become an array of with the same shape as a so the shapes are compatible for element-by-element multiplication. Now let us see an example where both arrays get stretched. Python
Output:import numpy as np a = np . array ([ 0.0 10.0 20.0 30.0 ]) b = np . array ([ 0.0 1.0 2.0 ]) print ( a [: np . newaxis ] + b )[[ 0. 1. 2.] [ 10. 11. 12.] [ 20. 21. 22.] [ 30. 31. 32.]]場合によっては、ブロードキャストによって両方の配列が拡張されて、どちらの初期配列よりも大きな出力配列が形成されることがあります。
日時の操作: Numpy has core array data types which natively support datetime functionality. The data type is called datetime64 so named because datetime is already taken by the datetime library included in Python. Consider the example below for some examples: PythonOutput:import numpy as np # creating a date today = np . datetime64 ( '2017-02-12' ) print ( 'Date is:' today ) print ( 'Year is:' np . datetime64 ( today 'Y' )) # creating array of dates in a month dates = np . arange ( '2017-02' '2017-03' dtype = 'datetime64[D]' ) print ( ' n Dates of February 2017: n ' dates ) print ( 'Today is February:' today in dates ) # arithmetic operation on dates dur = np . datetime64 ( '2017-05-22' ) - np . datetime64 ( '2016-05-22' ) print ( ' n No. of days:' dur ) print ( 'No. of weeks:' np . timedelta64 ( dur 'W' )) # sorting dates a = np . array ([ '2017-02-12' '2016-10-13' '2019-05-22' ] dtype = 'datetime64' ) print ( ' n Dates in sorted order:' np . sort ( a ))Date is: 2017-02-12 Year is: 2017 Dates of February 2017: ['2017-02-01' '2017-02-02' '2017-02-03' '2017-02-04' '2017-02-05' '2017-02-06' '2017-02-07' '2017-02-08' '2017-02-09' '2017-02-10' '2017-02-11' '2017-02-12' '2017-02-13' '2017-02-14' '2017-02-15' '2017-02-16' '2017-02-17' '2017-02-18' '2017-02-19' '2017-02-20' '2017-02-21' '2017-02-22' '2017-02-23' '2017-02-24' '2017-02-25' '2017-02-26' '2017-02-27' '2017-02-28'] Today is February: True No. of days: 365 days No. of weeks: 52 weeks Dates in sorted order: ['2016-10-13' '2017-02-12' '2019-05-22']NumPy の線形代数: NumPy の線形代数モジュールは、任意の numpy 配列に線形代数を適用するさまざまな方法を提供します。以下を見つけることができます:Consider the example below which explains how we can use NumPy to do some matrix operations. Python
Output:import numpy as np A = np . array ([[ 6 1 1 ] [ 4 - 2 5 ] [ 2 8 7 ]]) print ( 'Rank of A:' np . linalg . matrix_rank ( A )) print ( ' n Trace of A:' np . trace ( A )) print ( ' n Determinant of A:' np . linalg . det ( A )) print ( ' n Inverse of A: n ' np . linalg . inv ( A )) print ( ' n Matrix A raised to power 3: n ' np . linalg . matrix_power ( A 3 ))Rank of A: 3 Trace of A: 11 Determinant of A: -306.0 Inverse of A: [[ 0.17647059 -0.00326797 -0.02287582] [ 0.05882353 -0.13071895 0.08496732] [-0.11764706 0.1503268 0.05228758]] Matrix A raised to power 3: [[336 162 228] [406 162 469] [698 702 905]]Let us assume that we want to solve this linear equation set:x + 2*y = 8 3*x + 4*y = 18This problem can be solved using linalg.solve method as shown in example below: PythonOutput:import numpy as np # coefficients a = np . array ([[ 1 2 ] [ 3 4 ]]) # constants b = np . array ([ 8 18 ]) print ( 'Solution of linear equations:' np . linalg . solve ( a b ))Solution of linear equations: [ 2. 3.]Finally we see an example which shows how one can perform linear regression using least squares method. A linear regression line is of the form w1 x + w 2 = y であり、これは各データ点からラインまでの距離の二乗和を最小にするラインです。したがって、n 組のデータ (xi yi) が与えられた場合、探しているパラメーターは誤差を最小限に抑える w1 と w2 です。Let us have a look at the example below: Python
Output:import numpy as np import matplotlib.pyplot as plt # x co-ordinates x = np . arange ( 0 9 ) A = np . array ([ x np . ones ( 9 )]) # linearly generated sequence y = [ 19 20 20.5 21.5 22 23 23 25.5 24 ] # obtaining the parameters of regression line w = np . linalg . lstsq ( A . T y )[ 0 ] # plotting the line line = w [ 0 ] * x + w [ 1 ] # regression line plt . plot ( x line 'r-' ) plt . plot ( x y 'o' ) plt . show ()これで、この一連の NumPy チュートリアルは終了となります。 NumPy は広く使用されている汎用ライブラリで、scipy scikit-learn tensorflow matplotlib opencv などの他の多くの計算ライブラリの中核となっています。NumPy の基本を理解していると、他の高レベルのライブラリを効率的に扱うのに役立ちます。 参考文献:
クイズの作成
あなたにおすすめ
トップ記事


カテゴリ
 In above example the scalar b is stretched to become an array of with the same shape as a so the shapes are compatible for element-by-element multiplication. Now let us see an example where both arrays get stretched. Python
 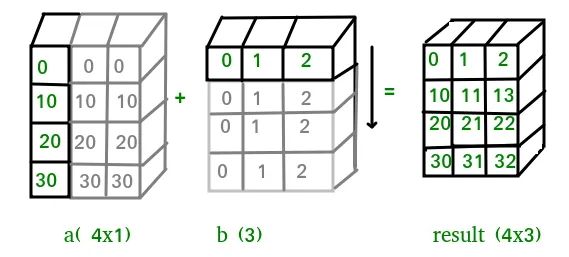 場合によっては、ブロードキャストによって両方の配列が拡張されて、どちらの初期配列よりも大きな出力配列が形成されることがあります。
 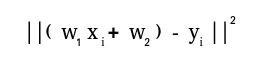 Let us have a look at the example below: Python
 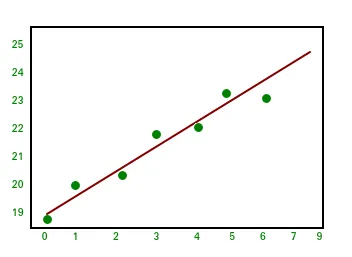 これで、この一連の NumPy チュートリアルは終了となります。 NumPy は広く使用されている汎用ライブラリで、scipy scikit-learn tensorflow matplotlib opencv などの他の多くの計算ライブラリの中核となっています。NumPy の基本を理解していると、他の高レベルのライブラリを効率的に扱うのに役立ちます。 参考文献: