NumPy Pythonissa | Sarja 2 (Lisäasetukset)
NumPy Pythonissa | Sarja 1 (johdanto) Tässä artikkelissa käsitellään joitain NumPyssä saatavilla olevia enemmän ja hieman edistyneempiä menetelmiä.
- taulukon rank determinant trace jne..
- omia arvoja tai matriiseja
- matriisi ja vektoritulot (pisteen sisäinen ulko jne. tulo) matriisin eksponentio
- ratkaise lineaarisia tai tensoriyhtälöitä ja paljon muuta!
- http://scipy.github.io/old-wiki/pages/EricsBroadcastingDoc
- https://numpy.org/doc/stable/reference/arrays.datetime.html#arrays-dtypes-dateunits
- https://numpy.org/doc/stable/reference/routines.linalg.html
- https://glowingpython.blogspot.com/2012/03/linear-regression-with-numpy.html
import numpy as np a = np . array ([[ 1 2 ] [ 3 4 ]]) b = np . array ([[ 5 6 ] [ 7 8 ]]) # vertical stacking print ( 'Vertical stacking: n ' np . vstack (( a b ))) # horizontal stacking print ( ' n Horizontal stacking: n ' np . hstack (( a b ))) c = [ 5 6 ] # stacking columns print ( ' n Column stacking: n ' np . column_stack (( a c ))) # concatenation method print ( ' n Concatenating to 2nd axis: n ' np . concatenate (( a b ) 1 ))
Output: Vertical stacking: [[1 2] [3 4] [5 6] [7 8]] Horizontal stacking: [[1 2 5 6] [3 4 7 8]] Column stacking: [[1 2 5] [3 4 6]] Concatenating to 2nd axis: [[1 2 5 6] [3 4 7 8]]
import numpy as np a = np . array ([[ 1 3 5 7 9 11 ] [ 2 4 6 8 10 12 ]]) # horizontal splitting print ( 'Splitting along horizontal axis into 2 parts: n ' np . hsplit ( a 2 )) # vertical splitting print ( ' n Splitting along vertical axis into 2 parts: n ' np . vsplit ( a 2 ))
Output: Splitting along horizontal axis into 2 parts: [array([[1 3 5] [2 4 6]]) array([[ 7 9 11] [ 8 10 12]])] Splitting along vertical axis into 2 parts: [array([[ 1 3 5 7 9 11]]) array([[ 2 4 6 8 10 12]])]
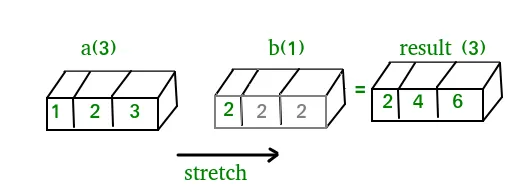
A(2-D array): 4 x 3 B(1-D array): 3 Result : 4 x 3A(4-D array): 7 x 1 x 6 x 1 B(3-D array): 3 x 1 x 5 Result : 7 x 3 x 6 x 5But this would be a mismatch:A: 4 x 3 B: 4The simplest broadcasting example occurs when an array and a scalar value are combined in an operation. Consider the example given below: PythonOutput:import numpy as np a = np . array ([ 1.0 2.0 3.0 ]) # Example 1 b = 2.0 print ( a * b ) # Example 2 c = [ 2.0 2.0 2.0 ] print ( a * c )[ 2. 4. 6.] [ 2. 4. 6.]We can think of the scalar b being stretched during the arithmetic operation into an array with the same shape as a. The new elements in b as shown in above figure are simply copies of the original scalar. Although the stretching analogy is only conceptual. Numpy is smart enough to use the original scalar value without actually making copies so that broadcasting operations are as memory and computationally efficient as possible. Because Example 1 moves less memory (b is a scalar not an array) around during the multiplication it is about 10% faster than Example 2 using the standard numpy on Windows 2000 with one million element arrays! The figure below makes the concept more clear:In above example the scalar b is stretched to become an array of with the same shape as a so the shapes are compatible for element-by-element multiplication. Now let us see an example where both arrays get stretched. Python
Output:import numpy as np a = np . array ([ 0.0 10.0 20.0 30.0 ]) b = np . array ([ 0.0 1.0 2.0 ]) print ( a [: np . newaxis ] + b )[[ 0. 1. 2.] [ 10. 11. 12.] [ 20. 21. 22.] [ 30. 31. 32.]]Joissakin tapauksissa yleislähetys venyttää molempia matriiseja muodostaen lähtötaulukon, joka on suurempi kuin jompikumpi alkuperäisistä taulukoista.
Työskentely päivämäärän ja ajan kanssa: Numpy has core array data types which natively support datetime functionality. The data type is called datetime64 so named because datetime is already taken by the datetime library included in Python. Consider the example below for some examples: PythonOutput:import numpy as np # creating a date today = np . datetime64 ( '2017-02-12' ) print ( 'Date is:' today ) print ( 'Year is:' np . datetime64 ( today 'Y' )) # creating array of dates in a month dates = np . arange ( '2017-02' '2017-03' dtype = 'datetime64[D]' ) print ( ' n Dates of February 2017: n ' dates ) print ( 'Today is February:' today in dates ) # arithmetic operation on dates dur = np . datetime64 ( '2017-05-22' ) - np . datetime64 ( '2016-05-22' ) print ( ' n No. of days:' dur ) print ( 'No. of weeks:' np . timedelta64 ( dur 'W' )) # sorting dates a = np . array ([ '2017-02-12' '2016-10-13' '2019-05-22' ] dtype = 'datetime64' ) print ( ' n Dates in sorted order:' np . sort ( a ))Date is: 2017-02-12 Year is: 2017 Dates of February 2017: ['2017-02-01' '2017-02-02' '2017-02-03' '2017-02-04' '2017-02-05' '2017-02-06' '2017-02-07' '2017-02-08' '2017-02-09' '2017-02-10' '2017-02-11' '2017-02-12' '2017-02-13' '2017-02-14' '2017-02-15' '2017-02-16' '2017-02-17' '2017-02-18' '2017-02-19' '2017-02-20' '2017-02-21' '2017-02-22' '2017-02-23' '2017-02-24' '2017-02-25' '2017-02-26' '2017-02-27' '2017-02-28'] Today is February: True No. of days: 365 days No. of weeks: 52 weeks Dates in sorted order: ['2016-10-13' '2017-02-12' '2019-05-22']Lineaarinen algebra NumPyssä: NumPyn Linear Algebra -moduuli tarjoaa erilaisia menetelmiä lineaarisen algebran soveltamiseen mihin tahansa numpy-taulukkoon. Löydät:Consider the example below which explains how we can use NumPy to do some matrix operations. Python
Output:import numpy as np A = np . array ([[ 6 1 1 ] [ 4 - 2 5 ] [ 2 8 7 ]]) print ( 'Rank of A:' np . linalg . matrix_rank ( A )) print ( ' n Trace of A:' np . trace ( A )) print ( ' n Determinant of A:' np . linalg . det ( A )) print ( ' n Inverse of A: n ' np . linalg . inv ( A )) print ( ' n Matrix A raised to power 3: n ' np . linalg . matrix_power ( A 3 ))Rank of A: 3 Trace of A: 11 Determinant of A: -306.0 Inverse of A: [[ 0.17647059 -0.00326797 -0.02287582] [ 0.05882353 -0.13071895 0.08496732] [-0.11764706 0.1503268 0.05228758]] Matrix A raised to power 3: [[336 162 228] [406 162 469] [698 702 905]]Let us assume that we want to solve this linear equation set:x + 2*y = 8 3*x + 4*y = 18This problem can be solved using linalg.solve method as shown in example below: PythonOutput:import numpy as np # coefficients a = np . array ([[ 1 2 ] [ 3 4 ]]) # constants b = np . array ([ 8 18 ]) print ( 'Solution of linear equations:' np . linalg . solve ( a b ))Solution of linear equations: [ 2. 3.]Finally we see an example which shows how one can perform linear regression using least squares method. A linear regression line is of the form w1 x + w 2 = y ja se on viiva, joka minimoi kunkin datapisteen ja suoran välisen etäisyyden neliöiden summan. Kun siis annetaan n dataparia (xi yi), etsimämme parametrit ovat w1 ja w2, jotka minimoivat virheen:Let us have a look at the example below: Python
Output:import numpy as np import matplotlib.pyplot as plt # x co-ordinates x = np . arange ( 0 9 ) A = np . array ([ x np . ones ( 9 )]) # linearly generated sequence y = [ 19 20 20.5 21.5 22 23 23 25.5 24 ] # obtaining the parameters of regression line w = np . linalg . lstsq ( A . T y )[ 0 ] # plotting the line line = w [ 0 ] * x + w [ 1 ] # regression line plt . plot ( x line 'r-' ) plt . plot ( x y 'o' ) plt . show ()Joten tämä johtaa tämän NumPy-opetusohjelman sarjan päätökseen. NumPy on laajalti käytetty yleiskäyttöinen kirjasto, joka on monien muiden laskentakirjastojen ytimessä, kuten scipy scikit-learn tensorflow matplotlib opencv jne. NumPyn perusymmärrys auttaa käsittelemään muita korkeamman tason kirjastoja tehokkaasti! Viitteet:
Luo tietokilpailu
Top Artikkelit


Luokka
Mielenkiintoisia Artikkeleita
 In above example the scalar b is stretched to become an array of with the same shape as a so the shapes are compatible for element-by-element multiplication. Now let us see an example where both arrays get stretched. Python
 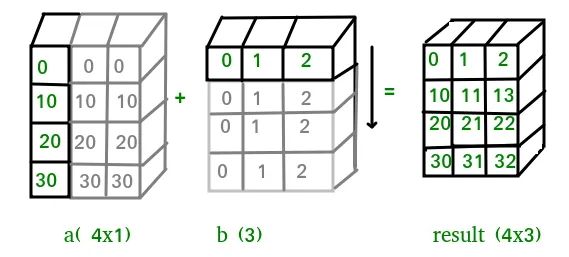 Joissakin tapauksissa yleislähetys venyttää molempia matriiseja muodostaen lähtötaulukon, joka on suurempi kuin jompikumpi alkuperäisistä taulukoista.
 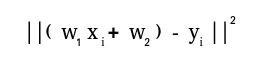 Let us have a look at the example below: Python
 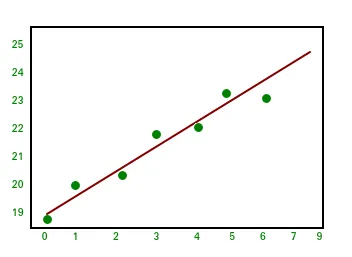 Joten tämä johtaa tämän NumPy-opetusohjelman sarjan päätökseen. NumPy on laajalti käytetty yleiskäyttöinen kirjasto, joka on monien muiden laskentakirjastojen ytimessä, kuten scipy scikit-learn tensorflow matplotlib opencv jne. NumPyn perusymmärrys auttaa käsittelemään muita korkeamman tason kirjastoja tehokkaasti! Viitteet: