NumPy w Pythonie | Zestaw 2 (zaawansowany)
NumPy w Pythonie | Zestaw 1 (Wprowadzenie) W tym artykule omówiono niektóre bardziej i nieco zaawansowane metody dostępne w NumPy.
- ślad wyznaczający rangę itp. tablicy.
- własne wartości lub macierze
- iloczyny macierzy i wektorów (iloczyn zewnętrzny kropki itp.) potęgowanie macierzy
- rozwiązuj równania liniowe lub tensorowe i wiele więcej!
- http://scipy.github.io/old-wiki/pages/EricsBroadcastingDoc
- https://numpy.org/doc/stable/reference/arrays.datetime.html#arrays-dtypes-dateunits
- https://numpy.org/doc/stable/reference/routines.linalg.html
- https://glowingpython.blogspot.com/2012/03/linear-regression-with-numpy.html
import numpy as np a = np . array ([[ 1 2 ] [ 3 4 ]]) b = np . array ([[ 5 6 ] [ 7 8 ]]) # vertical stacking print ( 'Vertical stacking: n ' np . vstack (( a b ))) # horizontal stacking print ( ' n Horizontal stacking: n ' np . hstack (( a b ))) c = [ 5 6 ] # stacking columns print ( ' n Column stacking: n ' np . column_stack (( a c ))) # concatenation method print ( ' n Concatenating to 2nd axis: n ' np . concatenate (( a b ) 1 ))
Output: Vertical stacking: [[1 2] [3 4] [5 6] [7 8]] Horizontal stacking: [[1 2 5 6] [3 4 7 8]] Column stacking: [[1 2 5] [3 4 6]] Concatenating to 2nd axis: [[1 2 5 6] [3 4 7 8]]
import numpy as np a = np . array ([[ 1 3 5 7 9 11 ] [ 2 4 6 8 10 12 ]]) # horizontal splitting print ( 'Splitting along horizontal axis into 2 parts: n ' np . hsplit ( a 2 )) # vertical splitting print ( ' n Splitting along vertical axis into 2 parts: n ' np . vsplit ( a 2 ))
Output: Splitting along horizontal axis into 2 parts: [array([[1 3 5] [2 4 6]]) array([[ 7 9 11] [ 8 10 12]])] Splitting along vertical axis into 2 parts: [array([[ 1 3 5 7 9 11]]) array([[ 2 4 6 8 10 12]])]
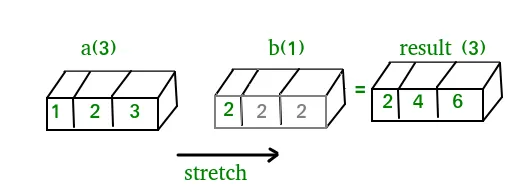
A(2-D array): 4 x 3 B(1-D array): 3 Result : 4 x 3A(4-D array): 7 x 1 x 6 x 1 B(3-D array): 3 x 1 x 5 Result : 7 x 3 x 6 x 5But this would be a mismatch:A: 4 x 3 B: 4The simplest broadcasting example occurs when an array and a scalar value are combined in an operation. Consider the example given below: PythonOutput:import numpy as np a = np . array ([ 1.0 2.0 3.0 ]) # Example 1 b = 2.0 print ( a * b ) # Example 2 c = [ 2.0 2.0 2.0 ] print ( a * c )[ 2. 4. 6.] [ 2. 4. 6.]We can think of the scalar b being stretched during the arithmetic operation into an array with the same shape as a. The new elements in b as shown in above figure are simply copies of the original scalar. Although the stretching analogy is only conceptual. Numpy is smart enough to use the original scalar value without actually making copies so that broadcasting operations are as memory and computationally efficient as possible. Because Example 1 moves less memory (b is a scalar not an array) around during the multiplication it is about 10% faster than Example 2 using the standard numpy on Windows 2000 with one million element arrays! The figure below makes the concept more clear:In above example the scalar b is stretched to become an array of with the same shape as a so the shapes are compatible for element-by-element multiplication. Now let us see an example where both arrays get stretched. Python
Output:import numpy as np a = np . array ([ 0.0 10.0 20.0 30.0 ]) b = np . array ([ 0.0 1.0 2.0 ]) print ( a [: np . newaxis ] + b )[[ 0. 1. 2.] [ 10. 11. 12.] [ 20. 21. 22.] [ 30. 31. 32.]]W niektórych przypadkach rozgłaszanie rozciąga obie tablice, tworząc tablicę wyjściową większą niż którakolwiek z tablic początkowych.
Praca z datą i godziną: Numpy has core array data types which natively support datetime functionality. The data type is called datetime64 so named because datetime is already taken by the datetime library included in Python. Consider the example below for some examples: PythonOutput:import numpy as np # creating a date today = np . datetime64 ( '2017-02-12' ) print ( 'Date is:' today ) print ( 'Year is:' np . datetime64 ( today 'Y' )) # creating array of dates in a month dates = np . arange ( '2017-02' '2017-03' dtype = 'datetime64[D]' ) print ( ' n Dates of February 2017: n ' dates ) print ( 'Today is February:' today in dates ) # arithmetic operation on dates dur = np . datetime64 ( '2017-05-22' ) - np . datetime64 ( '2016-05-22' ) print ( ' n No. of days:' dur ) print ( 'No. of weeks:' np . timedelta64 ( dur 'W' )) # sorting dates a = np . array ([ '2017-02-12' '2016-10-13' '2019-05-22' ] dtype = 'datetime64' ) print ( ' n Dates in sorted order:' np . sort ( a ))Date is: 2017-02-12 Year is: 2017 Dates of February 2017: ['2017-02-01' '2017-02-02' '2017-02-03' '2017-02-04' '2017-02-05' '2017-02-06' '2017-02-07' '2017-02-08' '2017-02-09' '2017-02-10' '2017-02-11' '2017-02-12' '2017-02-13' '2017-02-14' '2017-02-15' '2017-02-16' '2017-02-17' '2017-02-18' '2017-02-19' '2017-02-20' '2017-02-21' '2017-02-22' '2017-02-23' '2017-02-24' '2017-02-25' '2017-02-26' '2017-02-27' '2017-02-28'] Today is February: True No. of days: 365 days No. of weeks: 52 weeks Dates in sorted order: ['2016-10-13' '2017-02-12' '2019-05-22']Algebra liniowa w NumPy: Moduł Algebra Liniowa NumPy oferuje różne metody stosowania algebry liniowej na dowolnej tablicy numpy. Możesz znaleźć:Consider the example below which explains how we can use NumPy to do some matrix operations. Python
Output:import numpy as np A = np . array ([[ 6 1 1 ] [ 4 - 2 5 ] [ 2 8 7 ]]) print ( 'Rank of A:' np . linalg . matrix_rank ( A )) print ( ' n Trace of A:' np . trace ( A )) print ( ' n Determinant of A:' np . linalg . det ( A )) print ( ' n Inverse of A: n ' np . linalg . inv ( A )) print ( ' n Matrix A raised to power 3: n ' np . linalg . matrix_power ( A 3 ))Rank of A: 3 Trace of A: 11 Determinant of A: -306.0 Inverse of A: [[ 0.17647059 -0.00326797 -0.02287582] [ 0.05882353 -0.13071895 0.08496732] [-0.11764706 0.1503268 0.05228758]] Matrix A raised to power 3: [[336 162 228] [406 162 469] [698 702 905]]Let us assume that we want to solve this linear equation set:x + 2*y = 8 3*x + 4*y = 18This problem can be solved using linalg.solve method as shown in example below: PythonOutput:import numpy as np # coefficients a = np . array ([[ 1 2 ] [ 3 4 ]]) # constants b = np . array ([ 8 18 ]) print ( 'Solution of linear equations:' np . linalg . solve ( a b ))Solution of linear equations: [ 2. 3.]Finally we see an example which shows how one can perform linear regression using least squares method. A linear regression line is of the form w1 x + w 2 = y i jest to linia minimalizująca sumę kwadratów odległości od każdego punktu danych do linii. Zatem mając n par danych (xi yi), szukamy parametrów w1 i w2, które minimalizują błąd:Let us have a look at the example below: Python
Output:import numpy as np import matplotlib.pyplot as plt # x co-ordinates x = np . arange ( 0 9 ) A = np . array ([ x np . ones ( 9 )]) # linearly generated sequence y = [ 19 20 20.5 21.5 22 23 23 25.5 24 ] # obtaining the parameters of regression line w = np . linalg . lstsq ( A . T y )[ 0 ] # plotting the line line = w [ 0 ] * x + w [ 1 ] # regression line plt . plot ( x line 'r-' ) plt . plot ( x y 'o' ) plt . show ()Prowadzi to do zakończenia tej serii samouczków NumPy. NumPy jest powszechnie używaną biblioteką ogólnego przeznaczenia, która stanowi rdzeń wielu innych bibliotek obliczeniowych, takich jak scipy scikit-learn tensorflow matplotlib opencv itp. Podstawowa znajomość NumPy pomaga w efektywnym radzeniu sobie z innymi bibliotekami wyższego poziomu! Referencje:
Utwórz quiz
Może Ci Się Spodobać
Najpopularniejsze Artykuły


Kategoria
Ciekawe Artykuły


 In above example the scalar b is stretched to become an array of with the same shape as a so the shapes are compatible for element-by-element multiplication. Now let us see an example where both arrays get stretched. Python
 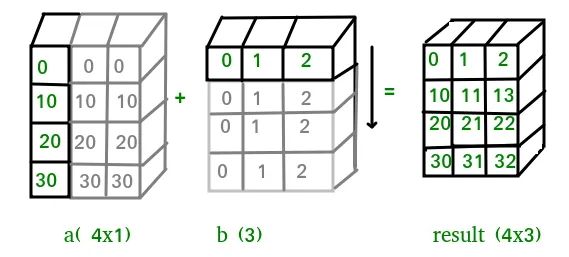 W niektórych przypadkach rozgłaszanie rozciąga obie tablice, tworząc tablicę wyjściową większą niż którakolwiek z tablic początkowych.
 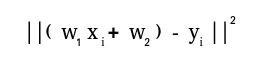 Let us have a look at the example below: Python
 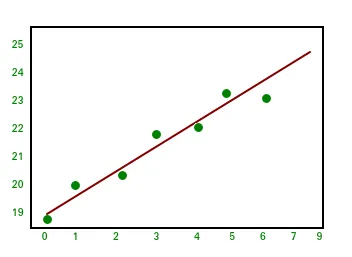 Prowadzi to do zakończenia tej serii samouczków NumPy. NumPy jest powszechnie używaną biblioteką ogólnego przeznaczenia, która stanowi rdzeń wielu innych bibliotek obliczeniowych, takich jak scipy scikit-learn tensorflow matplotlib opencv itp. Podstawowa znajomość NumPy pomaga w efektywnym radzeniu sobie z innymi bibliotekami wyższego poziomu! Referencje: